Wednesday 30 August 2017

Happy Melbourne Day!


Today is Melbourne Day. 182 years ago today, the city of Melbourne was founded.


This year Melbourne has again been chosen as the world's most liveable city, and I'm proud! Sure, it's not perfect: gentrification of the inner suburbs is squeezing out cultural and artistic individuality, and high house prices have led to increasing urban sprawl. As sad as it is, that's happening in most places. On the other hand, the crime rate is relatively low and public transport has vastly improved recently. I've written here about why I personally love Melbourne (though I haven't gotten around to writing that elusive Part 2 yet!).


Unlike many people who can't wait to move away from the place they were born, or wander from place to place never feeling like they fit in, I'm extremely lucky to be living in my home: the place where I belong.

Happy birthday, Melbourne!


Wednesday 23 August 2017

Slow Time

Recently I purchased Slow Time: Recovering the Natural Rythm of Life by Waverly Fitzgerald. It had been cropping up in recommendations for a few years now, so I thought I'd give it a try. The book is based on the author's 12-week course on time and our perception of it. From what I've read so far, there seem to be two aims:
1. changing our relationship to time to bring more peace and calmness to our lives;
2. creating personal rituals to acknlowledge and celebrate the passage of time.


I've always been interested in time, calendars and festivals, so my interest was piqued straight away, and I could always do with more calm in my life. As soon as I began to read the book, I knew that there was something important about it. I spent some time nearly every day reading it and working on the exercises (which are called 'Time Plays' to be less intimidating). I've been making sure to really take the time to let each section sink in before moving on to the next. I guess the concept of the book is having an effect on me already!


I completed Week 1 earlier today. Tasks for Week 1 included a reflection on my relationship to and beliefs about time, and how these have developed in my life. Another task was to think about how I want my relationship with time to be. I thought the most interesting task was to imagine that time was a friend, and write about your relationship with that friend: what you like about them, what you argue about, etc.

As well as the exercises designed to stimulate you to think differently about time, there are also observations about different cultures and how humanity's perception of time has changed. I found these very interesting and I'm looking forward to continuing.

Sunday 20 August 2017

My DNA Analysis -- Part 3


See Part 1 of this series to find out what I knew about my
family background before having a DNA test done. See Part 2 of this series for the results of my first test.

As I mentioned in my previous post in this series, I eventually decided to get my DNA tested again through a different company. It was a difficult decision to make -- the cost was even higher and, to be frank, I think Husband thought I was a little mad. But I had to know.

The second analysis was done through 23andMe, a company based in the U.S. The process was exactly the same as the other test. Because the kit was sent to me and sent back via courier, it was actually much faster than through AncestryDNA. The kit arrived at their lab within 3 days, and I had my results 3 weeks later. The analysis from 23andMe has reports from 4 different areas, not just my ancestry analysis, so I was interested to see what those were, too. (U.S. customers have access to health reports too, but these are not available for Australian customers. Some kind of annoying legal thing, typical...)

Here is my summary result:


And my detailed result:

EUROPEAN:
British & Irish: 55.5% (includes U.K., Irish)
French & German: 15.2% (includes Austrian, French, German, Belgian, Dutch, Swiss)
Scandinavian: 0.8% (includes Danish, Norwegian, Swedish)
Broadly Northwestern European: 27.8%
Broadly European: 0.6%

MIDDLE EASTERN & NORTH AFRICAN:
North African: < 0.1% (includes Algerian, Bahrani, Bedouin, Egyptian, Jordanian, Kuwaiti, Moroccan, Mozabite, Palestinian, Saudi Arabian, Tunisian, Emirati, Yemeni)

SUB-SAHARAN AFRICAN:
Broadly Sub-Saharan African: < 0.1%

ASIAN & NATIVE AMERICAN:
Native American: < 0.1% (includes Colombian, Karitiana, Maya, Pima, Surui)

If you've read my previous post about my results from AncestryDNA, you'll notice a few differences!

There is no Caucasian or South Asian DNA in this set of results. There's a lot less British, and barely any Scandinavian. There is no trace of Finnish or Russian in this set. However, there is African and -- a huge surprise -- Native American. However, remembering what I learned from my previous test, I reminded myself that these results are all probabilites, not definites.


The way the analysis is done is different too. My DNA is compared to samples from 31 regions, rather than 26 with AncestryDNA. The regions are split up differently, too -- British and Irish are one entity in this set. "French and German" is broadly equivalent to Western European in the other set, but the boundaries are different. My DNA was compared with 10,000 samples, which is more than Ancestry's sample size of 3,000, and of course the sample set comes from different people, so therefore the results could be different.


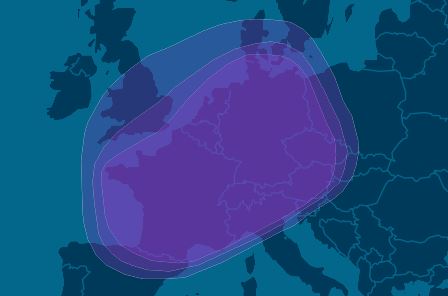
When I started looking deeper into these results, I saw that the way probability was handled is different. My data is displayed in the form of a 'Chromosome Painting.' I can choose the probability certainty of the results using a slider: from 50% through to 90%. 50% is the default, and this is what was displayed when I first saw my results. It means that for every piece of DNA examined, there was a 50% chance that it matched with a specific regional group. Actually, 50% doesn't seem a very high percentage to me! When I played with the slider, things looked very different.

Here is the slider set to 80%:


Now, the percentage of British & Irish DNA has dropped to 16.1%. The broader categories have risen. All of the lower-ranked regions have been relegated to the 'Unassigned' basket. Even with the slider set to 60%, the Native American portion of my DNA was shunted over to 'Unassigned'. It took a little while for this to sink in, but eventually this fact clicked in my brain:

Less than 1% of my DNA could be Native American, and
of that less-than-1%, there's a 40-50% chance it's from somewhere else.


And where that 'somewhere else' is, nobody knows. Perhaps I should be upset by this vague and unlikely result, but I'm not. It just confirms how difficult it is to pin down our DNA heritage.


This series of posts isn't meant to be a review or comparison of the two different tests. Both have different criteria, and different ways of displaying the results, neither of which is better than the other, I think. This website has a very comprehensive page on all the companies that offer genetic testing (currently 5). All offer slightly different services, so it's up to the individual to decide which one to choose. Apparently some hardcore genealogy fans have had tests done through all five!

Having a DNA analysis done is an experience that's hard to describe. It's a very emotional experience. Perhaps the emotions are different depending on whether you get along with your family or not, but they're there nevertheless. There's a chance that your DNA heritage could be different from your cultural heritage, and this could impact on your relationship with your family. There's also a financial component -- the test costs between $180 and $250, depending on the company. It's a big investment, and you want it to be worth it.

If you're thinking of having a DNA analysis done, here are a couple of things to keep in mind:

* Decide what kind of results you are looking for first: genetic testing, genealogy research, getting in touch with relatives, etc. and choose your service based on this.
* Don't expect precise results. DNA technology can't (and probably won't ever) be able to give you answers beyond a certain probability.
* Let go of any expectations. You may not be what you thought you were. Treat the analysis as a fact-finding mission, not a confirmation of what you think you know.


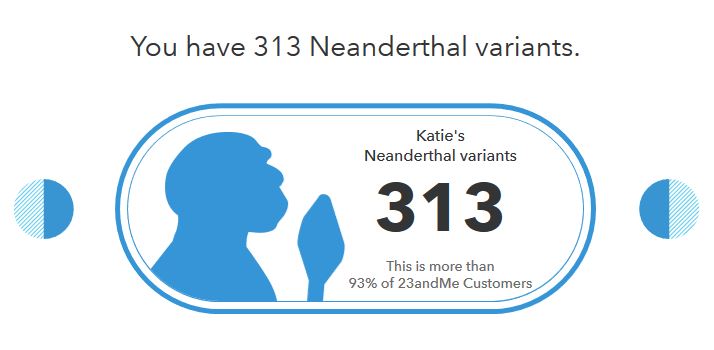
I, according to the results, am more Neanderthal than most people:

Thursday 17 August 2017

My DNA Analysis -- Part 2

See Part 1 of this series to find out what I knew about my family background before having the DNA test done.
Last year, individual ancestry reports via DNA analysis became available in Australia through AncestryDNA. I don't know very much about my ancestry and have always wanted to know more, so as soon as I heard about them, I very much wanted to have the report done.

The details of collecting the sample are slightly unsavoury, so I didn't take any photos. I received a kit with a tube in it, which I had to spit into until it reached a certain level. Then I sealed the tube into a bag and sent it back using the provided post satchel. After approximately 5 weeks, I received an email notifying me that my results were available and ready to see on the ancestry.com website.

WHAT THE REPORT SHOWED

Here is the summary graph of my DNA analysis:


Looking at the summary results, I could only come to the conclusion that I'm not what I thought I was. When I emailed the results to my Mum, I think she was a little shocked. She responded "after all you are 50% Dutch and as far as I know, the only mix on that side is some German and Swedish." (I didn't even know about the Swedish part before reading that email!) Surely then, my ancestry should have more Dutch in it and less British? It left me feeling very confused. When I looked further into the results however, I saw that things were much more complicated.

The AncestryDNA test compared my DNA to that of 3,000 samples from 26 regions in the world, and these were the results (most likely result is in brackets):

EUROPE: 98%
Great Britain: 40-96% (67%)
Ireland: 0-30% (14%)
Scandinavia: 0-25% (9%)

(The following were listed under "low confidence regions")

EUROPE: cont.
European Jewish: 0-5% (2%)
Italy/Greece: 0-5% (2%)
Western Europe: 0-9% (< 1%)

Finland/Northwest Russia: 0-3% (< 1%)

Iberian Peninsula: 0-2% (< 1%)

Eastern Europe: 0-3% (< 1%)


WEST ASIA: Caucasus: 0-3% (< 1%)


SOUTH ASIA: India and Surrounds: 0-1% (< 1%)


As you can see from the percentages above, the results are both very vague and very specific at the same time. Many of the results have a range starting from zero. This happens because my DNA is chopped into 40 pieces and each piece is analysed separately. So, for example, some pieces had anywhere up to 96% Great British DNA, but none had less than 40%. At least one piece had zero Scandinavian DNA, and the rest anywhere up to 25%, but the average amount was 9%.

Any region that has less than 15% maximum and 4.5% average is listed under "low confidence". This means that I am much less likely to have DNA from these groups than I do from the higher-percentage groups. These regions are shown on the map as a ring rather than a solid circle:


In my report, extensive information about each region can be found by clicking on it. There is a map, and illustrated information about the history of the area, similar to a Wikipedia page. Probability is also plotted on these maps in the form of concentric rings. For example, here is the map for the Great Britain region:


There are 3 concentric circles on the map, reflecting the area that people from this region come from. The probability is highest that people in this DNA group come from the central area. The probability is lower the further out you go. Note that the second ring on the Great Britain map covers the Netherlands, Belgium and northern France.


The map for Western Europe (above) also covers the Netherlands area. So, there's a possibility that I could have Dutch DNA heritage from either of these regions ... or none. And where did the Caucasus and South Asian DNA come from? Did I have an ancestor that travelled to Europe along the Silk Road? It was an exciting thought, but I'll never know the answer.

Other, more sobering thoughts came to me as well. What if I don't have as much Dutch heritage as I thought? Are my Dutch ancestors migrants that came from somewhere else relatively recently? And if so, where did they come from? I never really related to Irish culture much, but I could be up to 30% Irish -- how do I reconcile that? As the website explains, a person can inherit more DNA from one parent than the other ... would I have to acknowledge that more of my DNA comes from the side of my family I don't get along with?

That's the frustrating thing about getting a DNA analysis done. I'll never know for sure. All of the statistics are just probabilities, and statistics can't tell the story of human lives. It niggled at me for a long time. I wondered if the results were correct, if the 40 pieces of DNA were a representative sample. I even wondered if the sample had been contaminated. That's why I eventually decided to get a second opinion.

In the next post, I'll talk about my experience with getting a second test done through a different company: 23andMe.

Sunday 13 August 2017

My DNA Analysis -- Part 1


This post ended up being extremely long, so I've split it up into three parts. Today, I'll be talking about what I knew (or thought I knew...) before having the test done. Part Two will look at the results of my AncestryDNA test and why I decided to get a second test done. Part Three details the results of the 23andMe test and some final thoughts.


WHAT I KNEW BEFORE

I don't know that much about my ancestry. Many of my family members are out of touch, and of the others, mental illness and other factors have led to confusion about what is actually correct. My grandparents on my mother's side never liked to talk about the past because of the bad experiences they went through in World War II, and I always respected that and didn't press them.

{Picture Source}

This is the sum total of what I knew (or thought I knew!) about my ancestry before sending away for the report.

On my father's side, the family comes from England and there was a Scottish connection, and possibly Welsh. I can't remember the details very well as I was told them when I was a small child and possibly remember the details wrongly. The first ancestor on that side of the family to come to Australia was a policeman; he arrived here in the 1850s.

On a side note, this caused some embarrassment to me as a child! In 1988, at the time of the 200-year anniversary of the 'discovery'/invasion of Australia, interest in ancestry surged. A list of the convicts on the First Fleet, the first Europeans to settle in Australia, was released, allowing people to trace their ancestry back to these original founders. It was 'cool' to have a convict ancestor. In that atmosphere, I was almost ashamed at having a policeman as an ancestor!

This isn't my actual ancestor: just for illustration purposes!

{Picture Source}

On my mother's side, my family come from the Netherlands. My mother was born there and travelled to Australia with her family as a baby, arriving in 1956. (I remember that detail precisely because it was the same year the Olympics were in Melbourne!) This makes me a second-generation migrant on one side. I know that my family come from the southern area of the Netherlands, and I still keep in touch with some of my maternal grandmother's family there. I've been told that some of my ancestors were from Belgium and I apparently had an Italian great-auntie, but she wasn't in the direct line of my ancestry.

From these snippets passed on from my family, I would expect my ancestry to be entirely European -- mostly Western and Northern European.


I do have to admit, I've always related to the Dutch side of my ancestry much more than the British side. I'm not in contact with anyone from my father's side and, growing up, I spent a lot more time with my Dutch relatives than my British ones. I was exposed to Dutch customs, food, music and even interior decoration to such an extant that I started thinking of myself as a 'Dutch-Australian' rather than 'half-Dutch Australian'. Even though I knew my DNA would only be half-Dutch at most, I have to confess, I did have a hope going into this adventure that my bias would be confirmed.

In my next post, we'll find out!

{Picture Source}

Sunday 6 August 2017

My July

As I mentioned in my last post, this Winter has been a very cold one. I was sick through most of July, so I haven't done much. I did start a new craft project though, and have tried to pay attention to the things that make Winter my favourite season. (Or possibly second-favourite behind Autumn, I can never decide!)

What I've been making ...
I started a new crochet project -- a mat for oracle readings. I have a small mat for rune reading, but it's not suitable for cards, so I decided to make a larger one. I'm hoping to make it wide enough to accommodate 5 cards in a row, and perhaps do a border in a contrasting colour. The yarn was salvaged from a scarf that I started and then abandoned last year. It has a lustrous, silky feel to it which adds to the sense of it being special.


What I found ...
I did manage to go for some walks in between my foot getting better and then coming down with a cold. On one of them I found this huge, beautiful pincone, completely intact. What a gift!


Selections from Instagram